The project titled “Considering the Effects of Nonflat Terrain in the Parametric Wind Field Model for Typhoons (19ZR1469200)”, funded by the Natural Science Foundation of Shanghai, was approved in January, 2019.
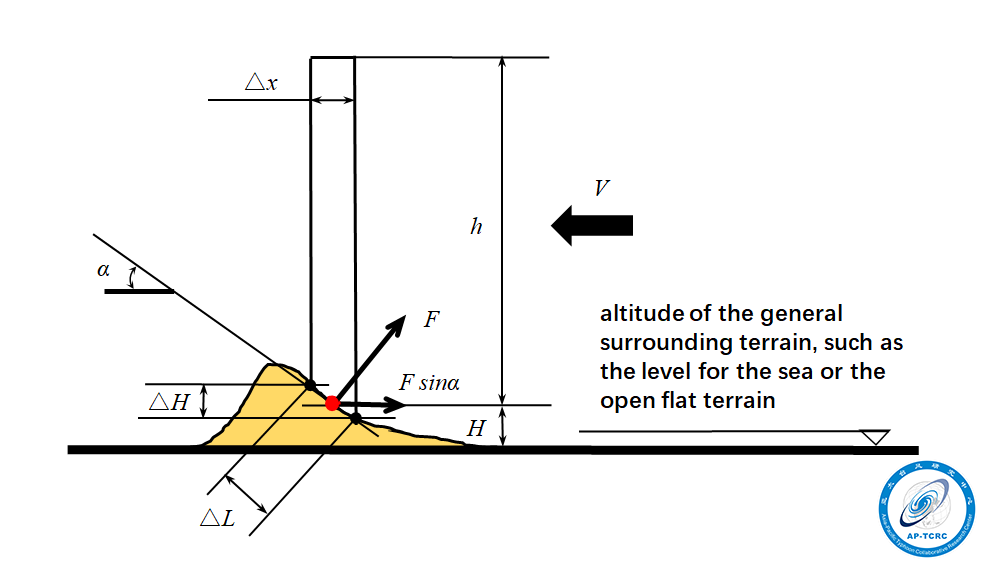
Modeling the resistance effects of the nonflat terrain to the wind fields is important. By using the terrain-following-coordinate system, the effects of nonflat terrain can be solved in the fully dynamic model, for example, the Weather Research and Forecasting Model (WRF), and the muti-layer parametric wind field model for typhoons. However, the above methods need more computational resource and storage capacity, especially in the evaluation aspects on the disaster, which usually needs calculations on the large samples of the order of magnitude over several ten thousand. One alternative method is to use the single-layer parametric wind field models for typhoons, in which the effects of nonflat terrain to the wind fields was modeled. In this project, a terrain drag coefficient ( ![]() ) was introduced with a theoretical consideration to characterize the resistance effects of nonflat terrain to the wind fields. Then, it was incorporated in a single-layer parametric wind field model for typhoons. The scheme diagraph for the deriving the terrain drag coefficient (
) was introduced with a theoretical consideration to characterize the resistance effects of nonflat terrain to the wind fields. Then, it was incorporated in a single-layer parametric wind field model for typhoons. The scheme diagraph for the deriving the terrain drag coefficient ( ![]() ) is shown in Figure 1, and the corresponding control equation for the single-layer parametric wind field model for typhoons is as the follow:
) is shown in Figure 1, and the corresponding control equation for the single-layer parametric wind field model for typhoons is as the follow:

where, ![]() is horizontal velocity relative to the TC center;
is horizontal velocity relative to the TC center; ![]() is the moving velocity of the TC vortex;
is the moving velocity of the TC vortex; ![]() is the large-scale environmental steering flow;
is the large-scale environmental steering flow; ![]() is the Coriolis parameter,
is the Coriolis parameter, ![]() is the average angular velocity of the Earth’s rotation,
is the average angular velocity of the Earth’s rotation, ![]() is the latitude of the TC center;
is the latitude of the TC center; ![]() is the unit vector in the vertical direction;
is the unit vector in the vertical direction; ![]() is the standard atmospheric density (1.225
is the standard atmospheric density (1.225 ![]() );
); ![]() is the pressure corresponding to
is the pressure corresponding to ![]() ;
; ![]() is the drag coefficient corresponding to the resistance effects of the topographic features;
is the drag coefficient corresponding to the resistance effects of the topographic features; ![]() is the depth of the mean boundary layer and roughly equals the height of the mean boundary layer; the new term
is the depth of the mean boundary layer and roughly equals the height of the mean boundary layer; the new term ![]() was included, and
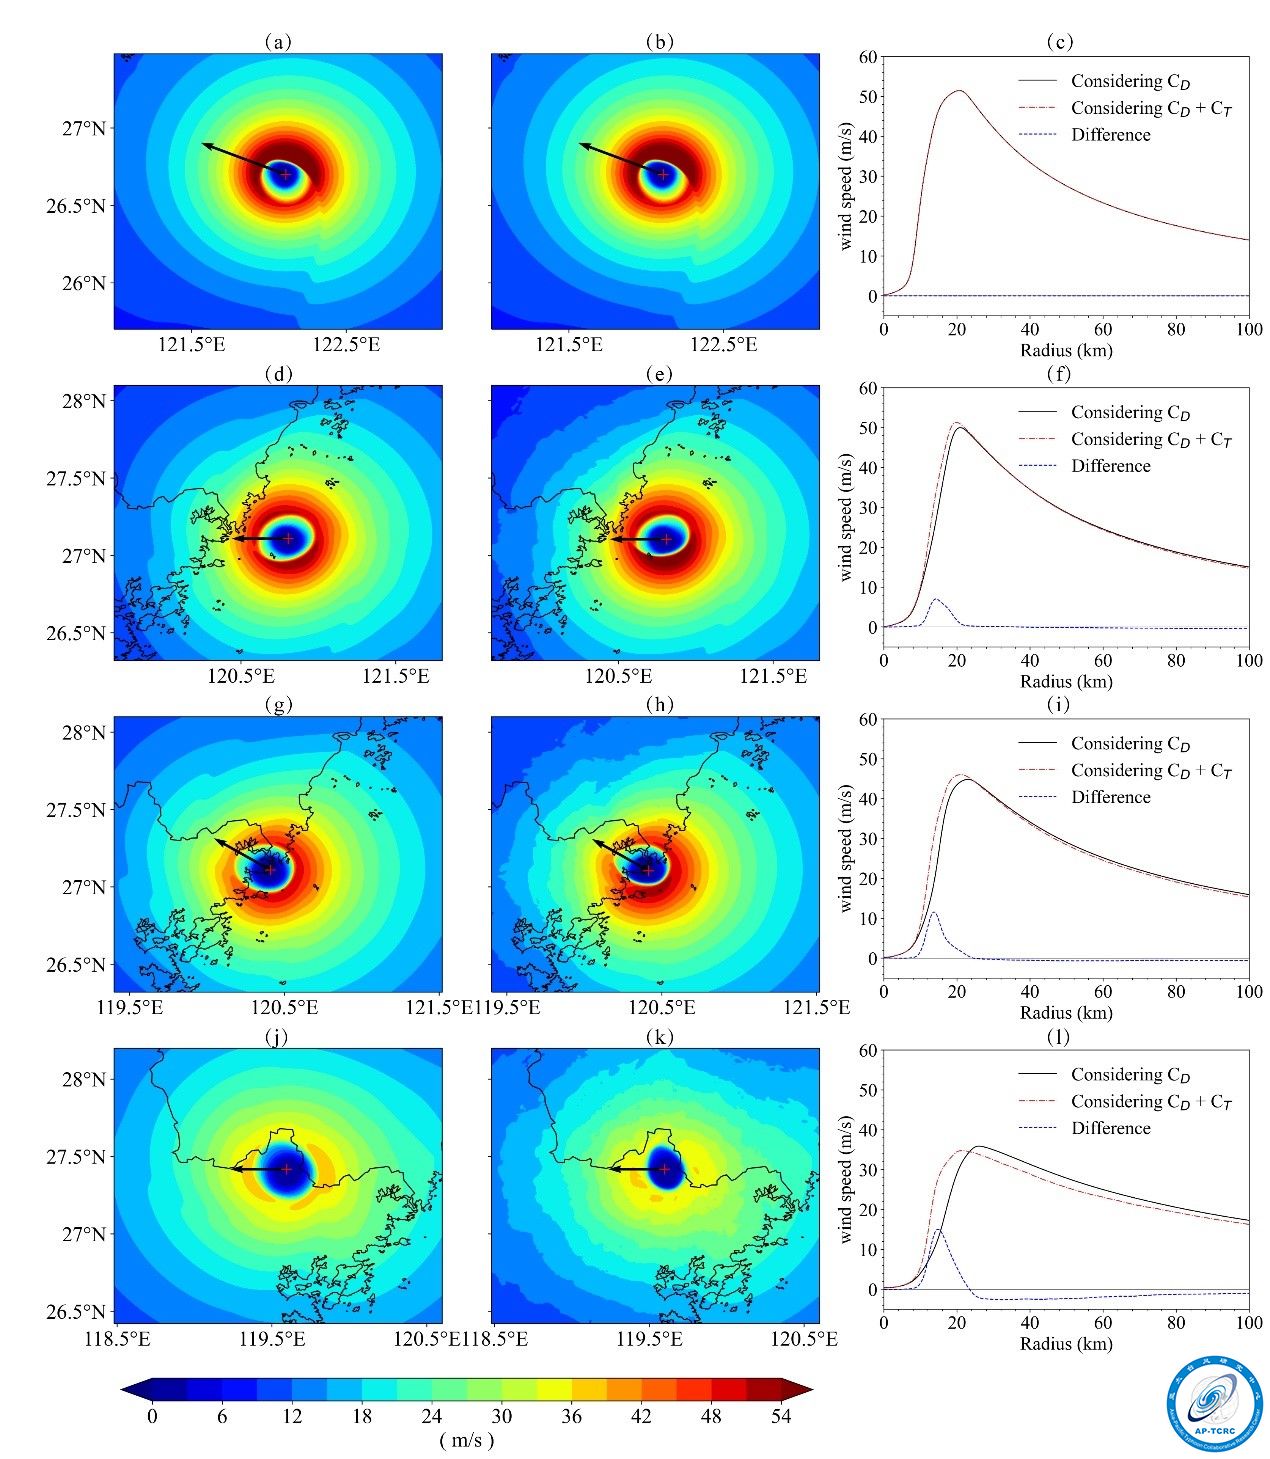
was included, and ![]() is the pressure coefficient at the site point, as shown in Figure 1. As a demonstration on effects of the nonflat terrain to the wind fields, Super Typhoon Saomai in the year of 2006 (0608) is simulated because it made landfall at a site in southern Zhejiang Province, where the terrain is the most complex along the coastal zone in China. Effects of the nonflat terrain to the near surface wind fields can be seen, as shown in Figure 2. It can be clearly seen that the ring of the maximum wind was shrunk when compared to that without considering
is the pressure coefficient at the site point, as shown in Figure 1. As a demonstration on effects of the nonflat terrain to the wind fields, Super Typhoon Saomai in the year of 2006 (0608) is simulated because it made landfall at a site in southern Zhejiang Province, where the terrain is the most complex along the coastal zone in China. Effects of the nonflat terrain to the near surface wind fields can be seen, as shown in Figure 2. It can be clearly seen that the ring of the maximum wind was shrunk when compared to that without considering ![]() .
.

Figure 1. Schematic diagram of the effects of nonflat terrain on the air column. ![]() is the height of site point,
is the height of site point, ![]() is the mesh size,
is the mesh size, ![]() is the slope angle, then
is the slope angle, then ![]() is the length along the interface,
is the length along the interface, ![]() is the altitude difference corresponding to
is the altitude difference corresponding to ![]() .
. ![]() is the resistance force produced by the terrain on the air column,
is the resistance force produced by the terrain on the air column, ![]() is the horizontal component of resistance force.
is the horizontal component of resistance force. ![]() is the moving speed of the air column,
is the moving speed of the air column, ![]() is the boundary layer height.
is the boundary layer height.

Figure 2. Simulated wind fields at 10 m above the underlying surface for the ![]() case (left column: a, d, g, and j) and
case (left column: a, d, g, and j) and ![]() +
+ ![]() case (middle column: b, e, h, and k) of Super Typhoon Saomai (0608). The typhoon center is over the sea far away from the land (a and b, at 10:00 on 10 August before landfall); over the sea near the land (d and e, at 16:00 on 10 August before landfall); over the coastal zone (g and h, at 18:00 on 10 August right after landfall); and entirely over the land (g and h, at 22:00 on 10 August after landfall). The corresponding azimuth-averaged radial wind profiles and their differences are also shown in the right column (c, f, i, and l). The black arrow symbol shows the moving direction, and the red plus symbol indicates the typhoon center.
case (middle column: b, e, h, and k) of Super Typhoon Saomai (0608). The typhoon center is over the sea far away from the land (a and b, at 10:00 on 10 August before landfall); over the sea near the land (d and e, at 16:00 on 10 August before landfall); over the coastal zone (g and h, at 18:00 on 10 August right after landfall); and entirely over the land (g and h, at 22:00 on 10 August after landfall). The corresponding azimuth-averaged radial wind profiles and their differences are also shown in the right column (c, f, i, and l). The black arrow symbol shows the moving direction, and the red plus symbol indicates the typhoon center.